by Kurt Scholle
How to Use Google Analytics
Improve Your Website and Increase Sales
 One of the most important things I teach is Google Analytics for beginners. You can’t succeed in any business without knowing your numbers; being able to define where you are now, what can be improved and then monitoring the results of your efforts.
You can also use the Key Performance Indicators available in Google Analytics to drill down to specific content that needs your attention, much as a doctor takes your vital signs or your financial planner evaluates your portfolio of stocks and bonds.
With that knowledge, you can build a better blog or E-commerce site. In this post, we’ll be looking at basic, but ESSENTIAL Google Analytics for beginners, and in future posts we’ll get a little more advanced.
What is Google Analytics?
Google Analytics is a free web analytics service offered by Google that tracks and reports how users find and use your website. They offer a full menu of KPIs (see below), currently as a platform inside the Google Marketing Platform brand. Google launched the service in November 2005 after acquiring Urchin, a popular analytics package.
There are dozens of analytics packages available, including Baidu Analytics, Yandex Metrica, Statcounter, YAHOO! Web Analytics and Clicky. Google Analytics is by far, the most popular and estimated to be in use on over 50% of the world’s websites.
For Enterprise applications, Google Analytics is still very popular in addition to Adobe Analytics.
Focusing on Google Analytics for beginners, we find useful website metrics just on the Home page. The four most important and reported metrics are probably Users, Sessions, Bounce Rate and Duration, which we will address below.
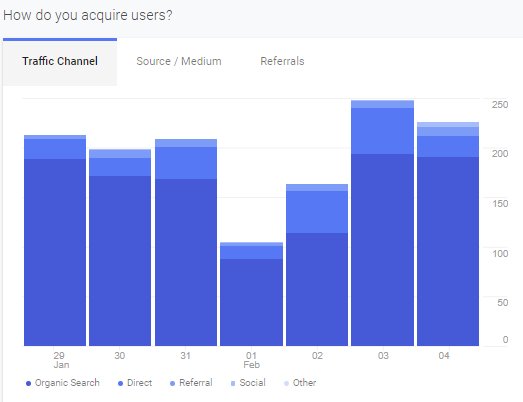
How did you acquire Users? You can look at what TYPE of traffic we’re getting; usually Organic Search from the search engines, Direct traffic when someone types in the URL, and Referral and Social Media. If you send enough emails, your Traffic Acquisition graph will break out Email traffic too! Great insights, huh?
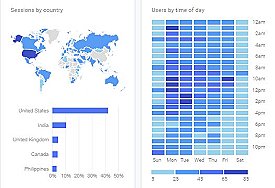 Google also shows us where in the world our traffic is coming from and which hours of the week are most popular!
Most website hosting companies offer some form of analytics with at least basic information, but Google Analytics is a standard and using Google Analytics in addition to Google Search Console, formerly Webmaster Tools, may help you rank in the biggest search engine for the keywords you covet.
Google Analytics gives you the tools you need to analyze data for your business website in one place.
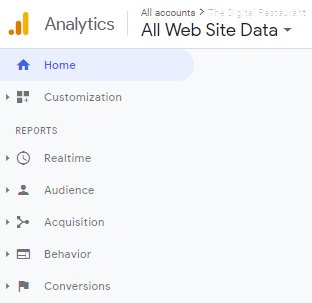
When you’ve accessed Google Analytics, you’ll see the NAV or navigation on the left side of the screen. In the upper-left, you’ll find different reports related to Realtime visits, your Audience, Acquisition of the audience, their Behavior while on the site and the Conversions.
Scroll down to the bottom-left and you’ll see links for Admin functions.
The heart of the Home page has graphic representations of important Metrics or KPIs. Let’s look at them below.
Google Analytics gives you the tools you need to analyze data for your business website, giving you a better understanding of your site, its visitors and your advertising ROI. Share on XWhat is a Metric in Google Analytics?
Google Analytics metrics are Key Performance Indicators and just as important as knowing how much money you have in the bank or what your monthly expenses are. There are basic metrics and some that are more advanced.
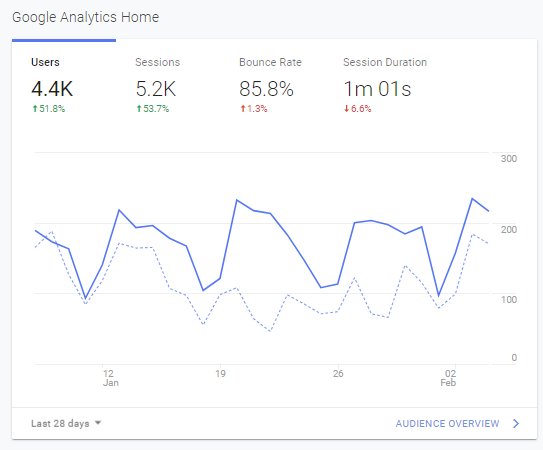
I find that many website owners and managers don’t have much of an understanding of the basics, including Users (How many people visit your site.), Sessions (How many times Users visit your site.) Bounce Rate (The percentage of Users who land on one page of your site and never visit another page.) and Session Duration (The amount of time site visitors spend on your site.)
In the example above, notice in the lowers left corner that the information is based an the previous 28 days. With most reports, you can define the specific time from from one day to YEARS. You can learn more by clicking Audience Overview in the lower right corner.
In this example, there were 4,400 Users, sometimes referred to as Visitors, which was up 51.8% over the previous timeframe.
What are Sessions in Google Analytics?
These 4.4k Users visited the site for 5,200 Sessions, a gain of 53.7% Sessions are sometimes referred to as Visits or Hits. Hits is kind of a misnomer and should not be used.
What is Bounce Rate?
 The Bounce Rate was 85.8%, which means that 14.2% of the site’s visitors did not look at more than one page on the site. That’s too high. It means that people are not resonating with your content. Create better content!
Try and get your Bounce Rate below 50% by looking at the pages & posts with the highest individual Bounce Rates. You can sort them in Google Analytics.
The average Session Duration was only 1 minute and 1 second (1:01). We MIGHT accept 2 and a half minutes, but it depends on the site. We prefer 3:00-4:00 on average.
Bounce Rate and Session Duration are Loyalty KPIs. In this case, the visitors are just not that into what they’re finding.
The importance of using Google Analytics for beginners is knowing your numbers. What content is attracting visitors to your site? What needs fixing? Share on XGoogle Analytics Training
Google offers training on Google Analytics. Go beyond Google Analytics for Beginners and learn from the insights and more advanced setup and tracking. Click here!
Since this article was written, Google has released Google Analytics 4.0. Read more here.
In the meantime; Got questions?


